AI & Web3 · Design · 2026
Hybrid AI Agent Platform
A futuristic landing page and user dashboard for an AI-agent training ecosystem, using a high-contrast "Cyber-Purple" dark mode to visualize neural networks.
- Figma
Overview
The Hybrid AI Agent Platform is an AI-training ecosystem where people turn their own knowledge and data into personal AI agents, put those agents to work and earn token rewards along the way. We designed the landing page and the user dashboard, along with the tokenomics and roadmap views and the mobile experience.
Our scope covered UI/UX design, the landing page and the dashboard. The task was to give a technically dense product a visual language that feels advanced and powerful while staying organized and easy to follow.
The challenge
The AI industry moves fast, and many platforms struggle to make "training AI agents" accessible to everyday users. The concept is abstract. There is no physical object to show, and progress is measured in epochs, accuracy and loss curves that mean little to most people.
On top of that, the platform carries Web3 data that users and investors expect to see: token supply, liquidity, staking and a multi-phase roadmap. All of it had to fit into an interface with a sleek, high-tech energy without becoming a wall of charts. Power users would also spend long sessions in the dashboard, so comfort over time mattered as much as first impressions.
Goals
- Make training an AI agent feel tangible and approachable for non-specialists.
- Present dense data (tokenomics, roadmap phases, training progress) with clarity.
- Guide users clearly through the three pillars of training, usability and rewards.
- Keep the interface comfortable for power users during long sessions.
- Carry the same identity to mobile while keeping text readable and CTAs easy to reach.
Our approach
We called the design direction "Neon-Neural". It is built on two ideas: deep interaction and data clarity. Every screen should feel alive, and every number should be easy to find.
- Dark mode by default. Deep violet and neon purple on a near-black "dark matter" background reduce eye strain for power users and give the product a premium feel.
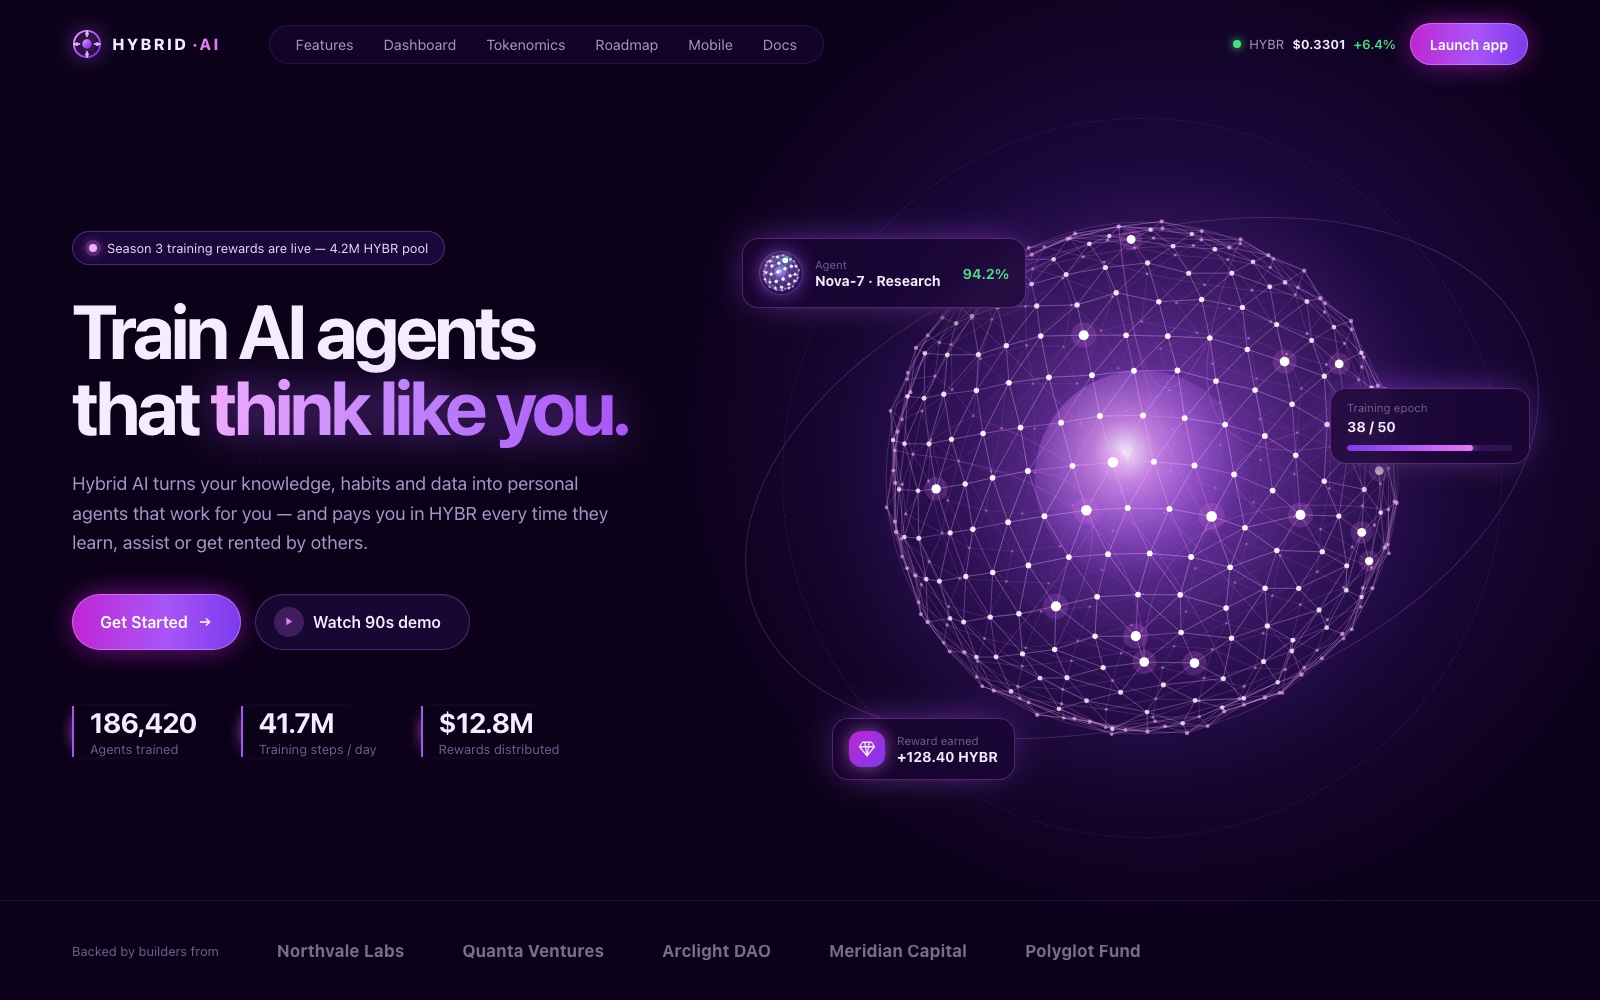
- Agents as living objects. Instead of static charts and stock illustrations, each agent is shown as a glowing neural sphere, and training is shown as layers of connected nodes. The technology becomes something users can look at, not just read about.
- Modular, component-based layout. FAQ, roadmap, stat and agent components are built as reusable modules. Users can scan the project's utility and timeline quickly, and new content slots in without breaking the grid.
What we built
Landing hero
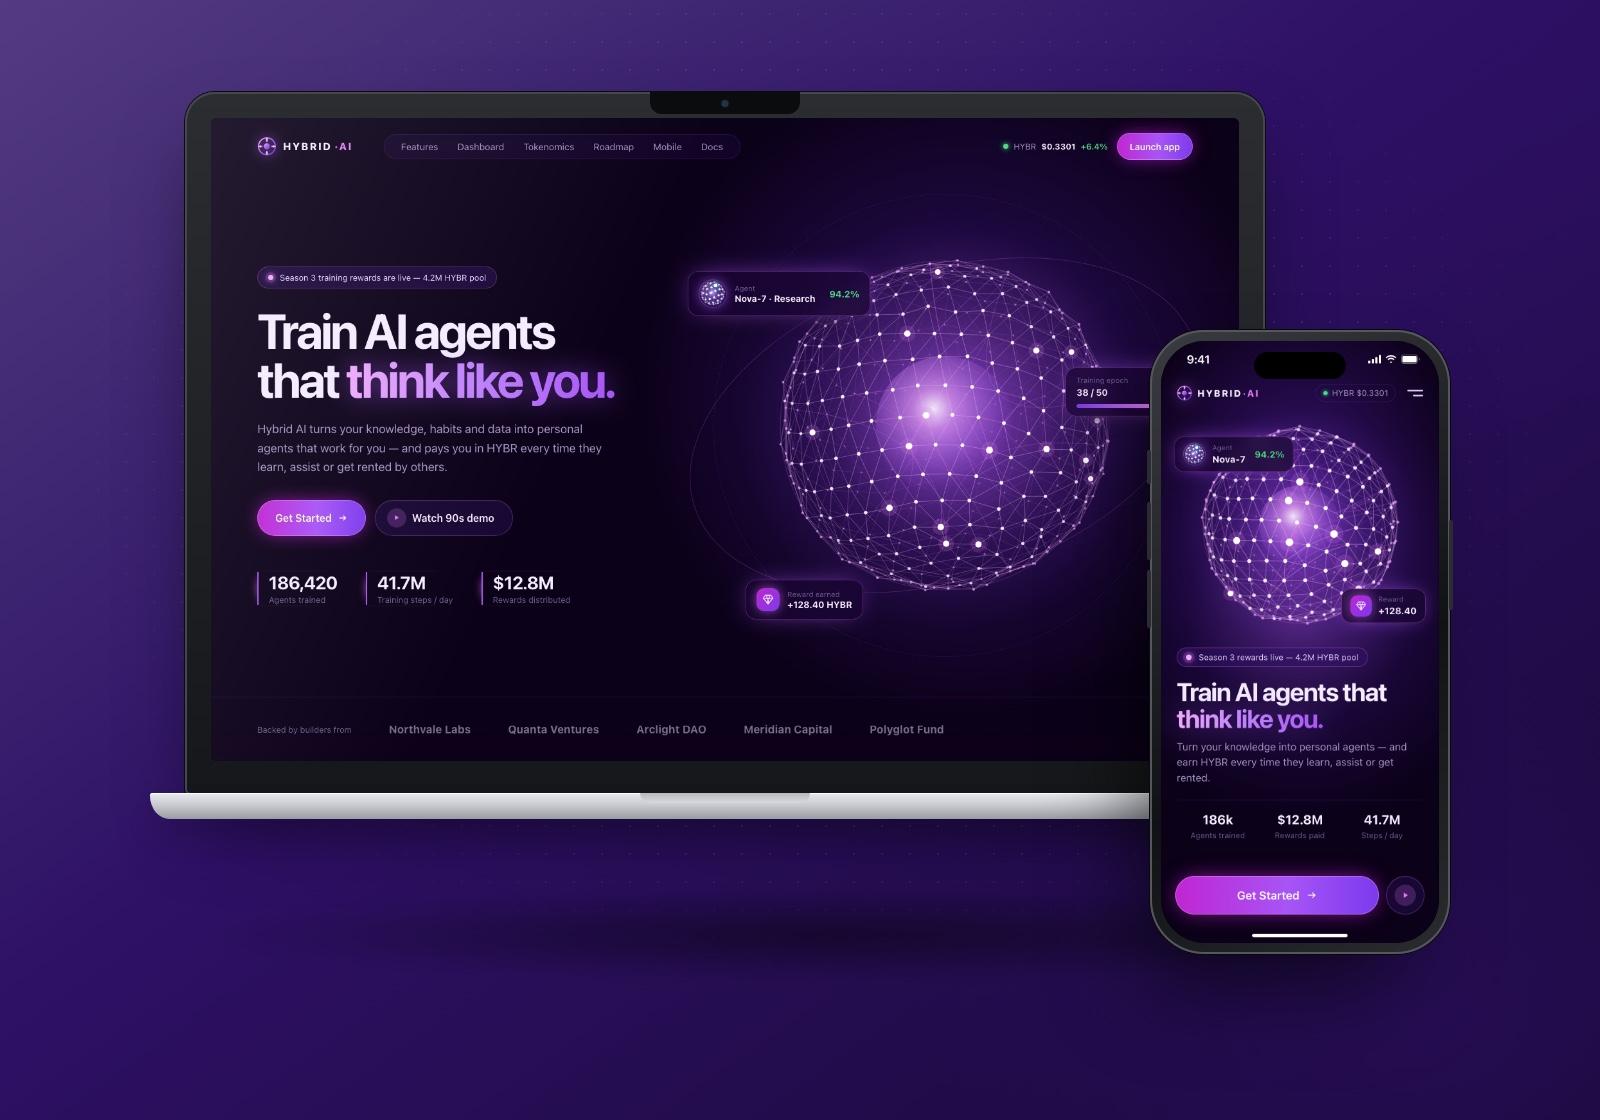
The hero leads with a plain promise about training agents that think like you, supported by one short paragraph on how the platform works. "Get Started" is the primary action, with a demo video as a softer second option. The glowing neural sphere on the right is the brand's central image. Floating cards around it hint at the product (an agent, a training epoch, a reward earned) before users scroll.
Features with neural sidebar
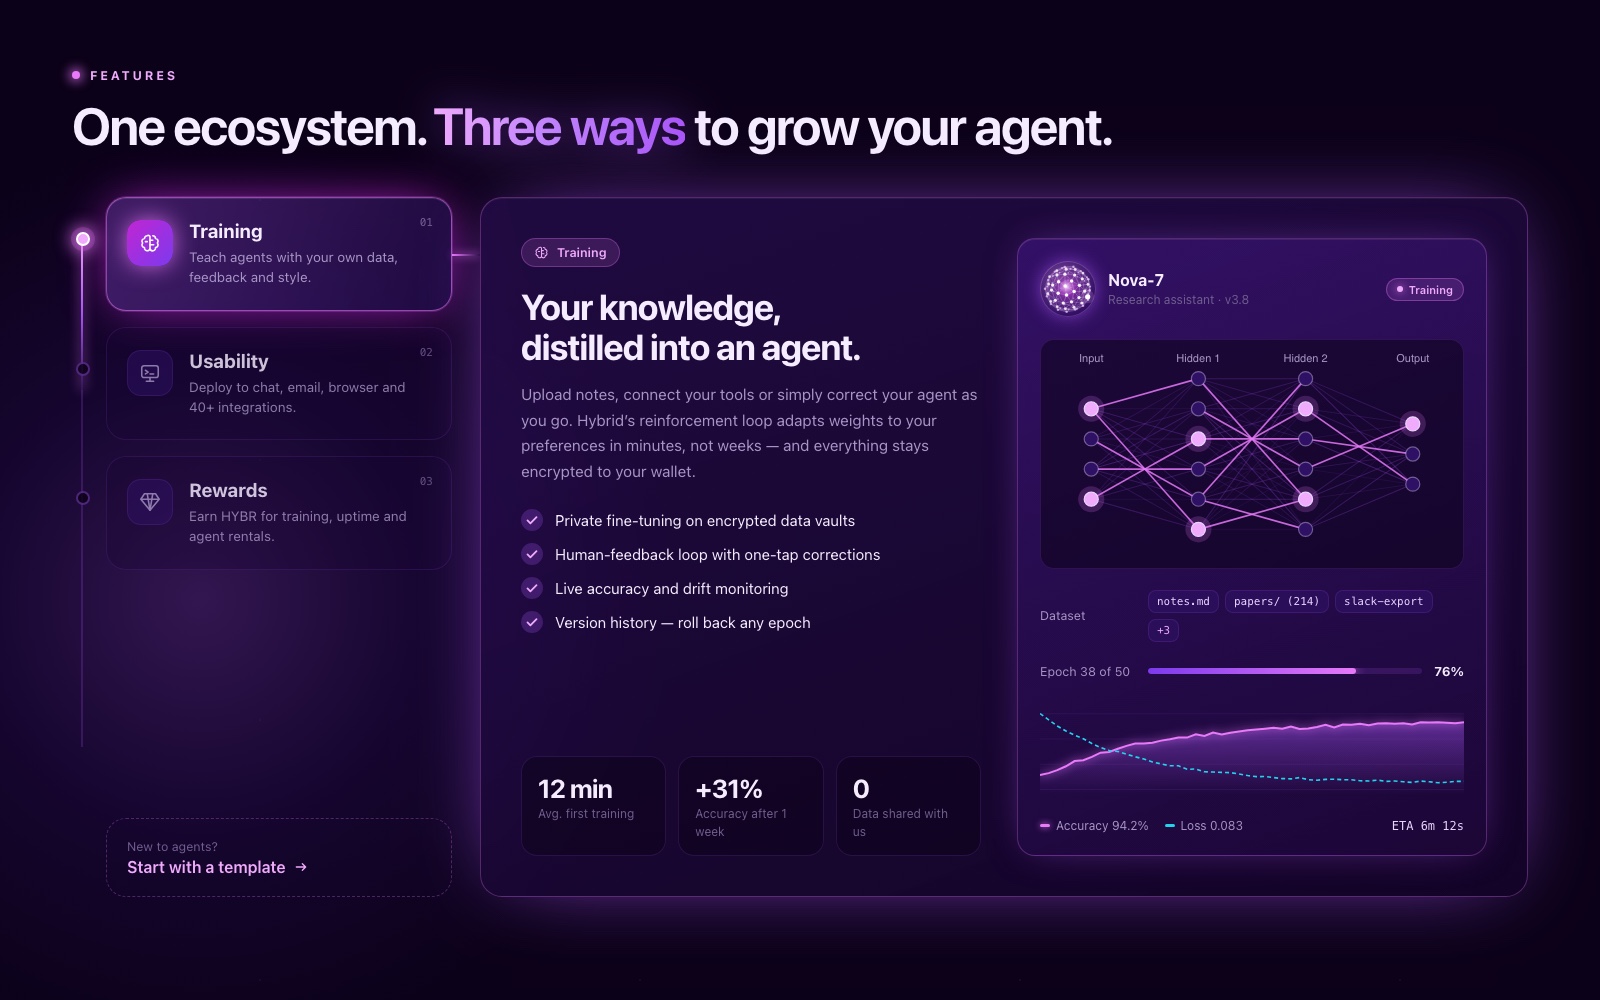
The features section uses an interactive sidebar with three tabs: Training, Usability and Rewards. The active tab glows and connects to the content panel by a lit line, so users always know where they are. Each panel pairs a short explanation and a checklist of capabilities with a live-looking product view, in this case a neural network diagram, dataset chips and an accuracy curve. A "start with a template" prompt gives newcomers a low-effort entry point.
Agent training dashboard
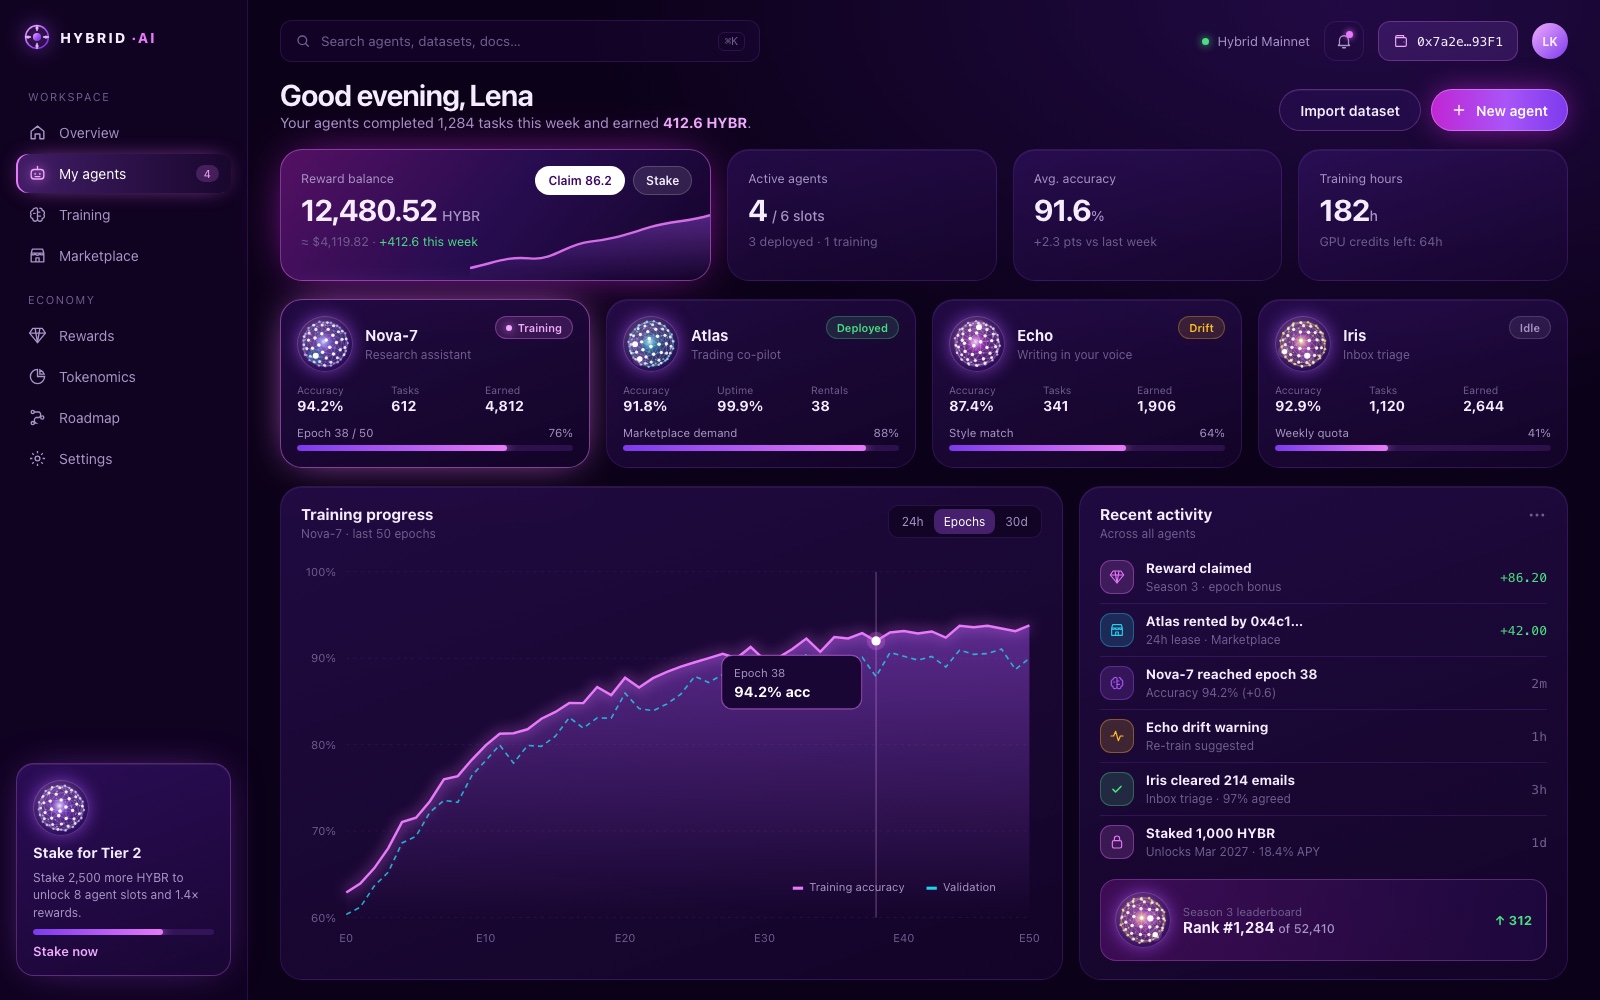
The signed-in dashboard is where power users spend their time. A row of summary cards covers reward balance, active agents, average accuracy and training hours. Below that, each agent gets its own card with a sphere avatar, a status tag (training, deployed, drift, idle) and a progress bar. A large training-progress chart and a recent-activity feed fill the lower half, so users can monitor performance and act on alerts from the same view.
Tokenomics
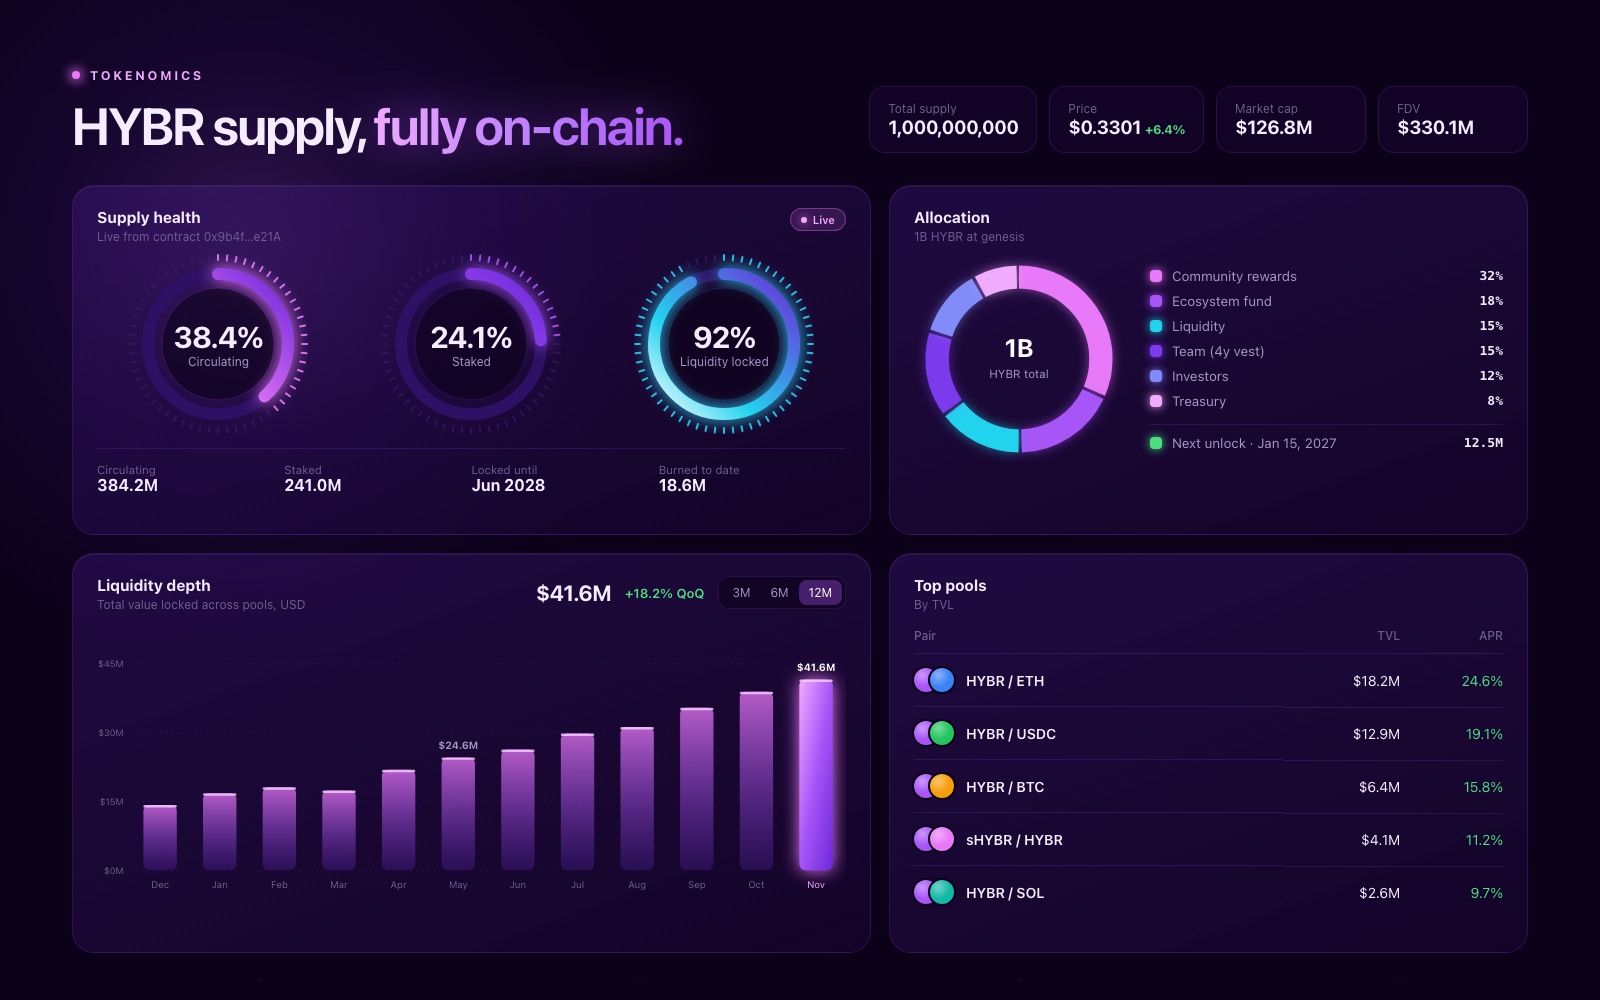
The tokenomics view turns supply and liquidity data into a small set of clear modules. Circular gauges show the circulating, staked and locked shares of supply. An allocation ring and legend break down distribution, a bar chart tracks liquidity depth over time and a table ranks the top pools. Every chart uses the same neon style, so the page reads as one system.
Phase-based roadmap
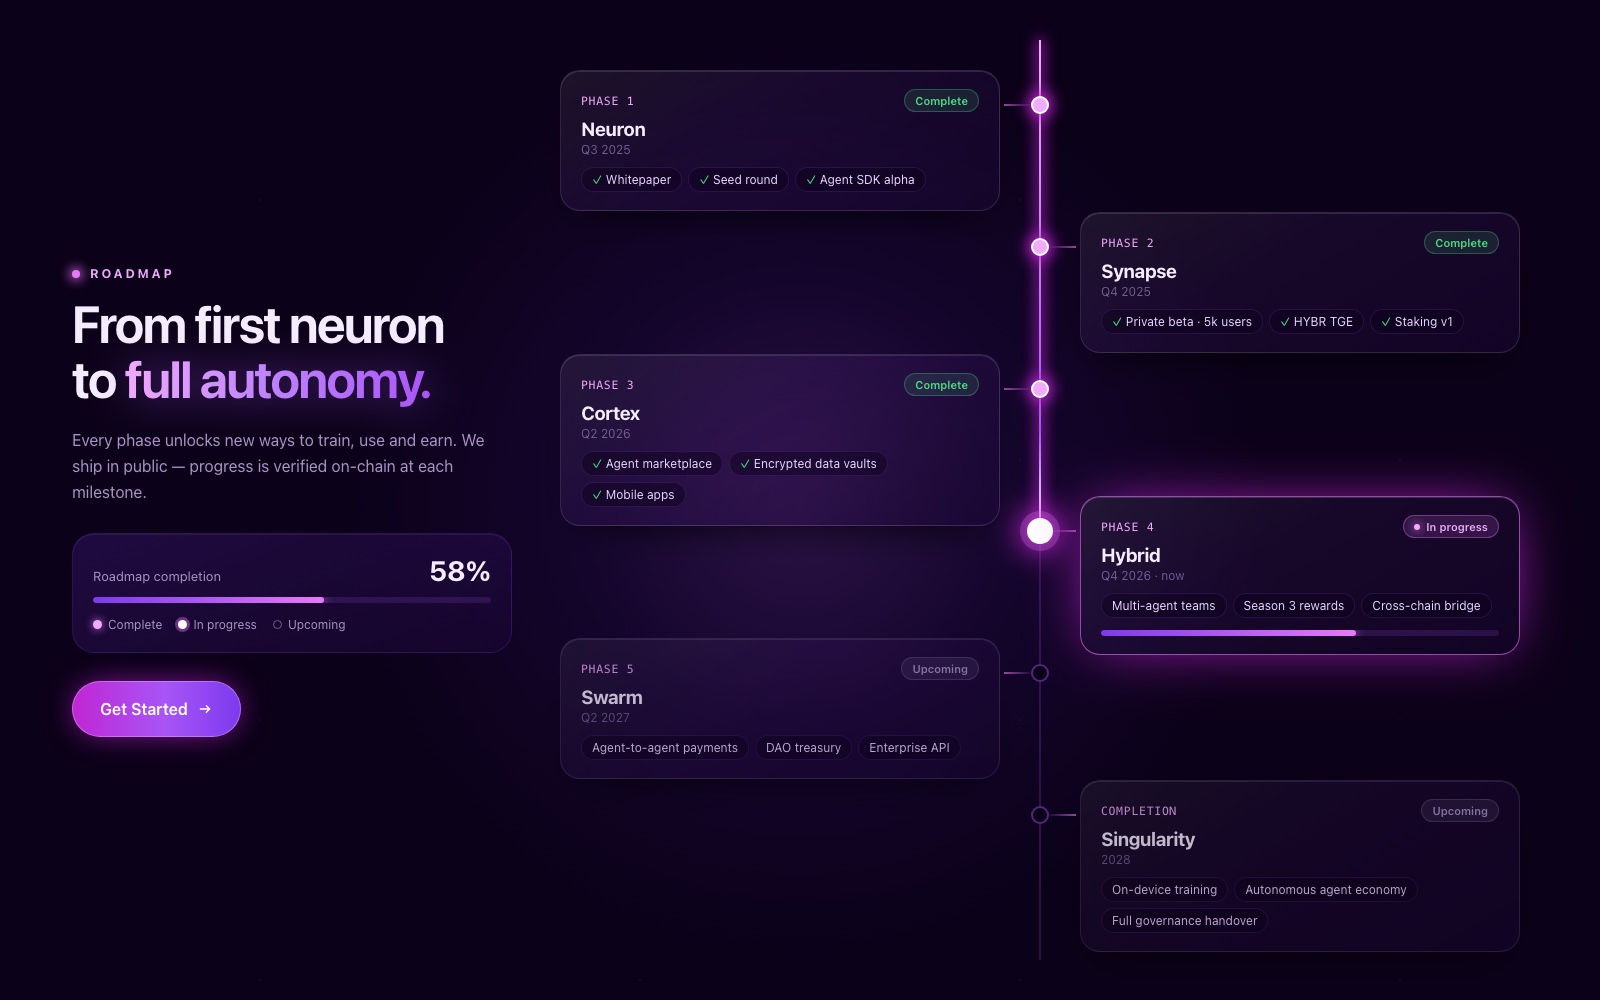
The roadmap is a vertical timeline with glowing nodes and glassmorphism cards that alternate either side of the line, from Phase 1 through to completion. Completed phases are marked with ticks, the current phase is lit and carries a progress bar, and upcoming phases are dimmed. A completion summary and a second "Get Started" button sit alongside, so the timeline also works as a conversion point.
Mobile experience
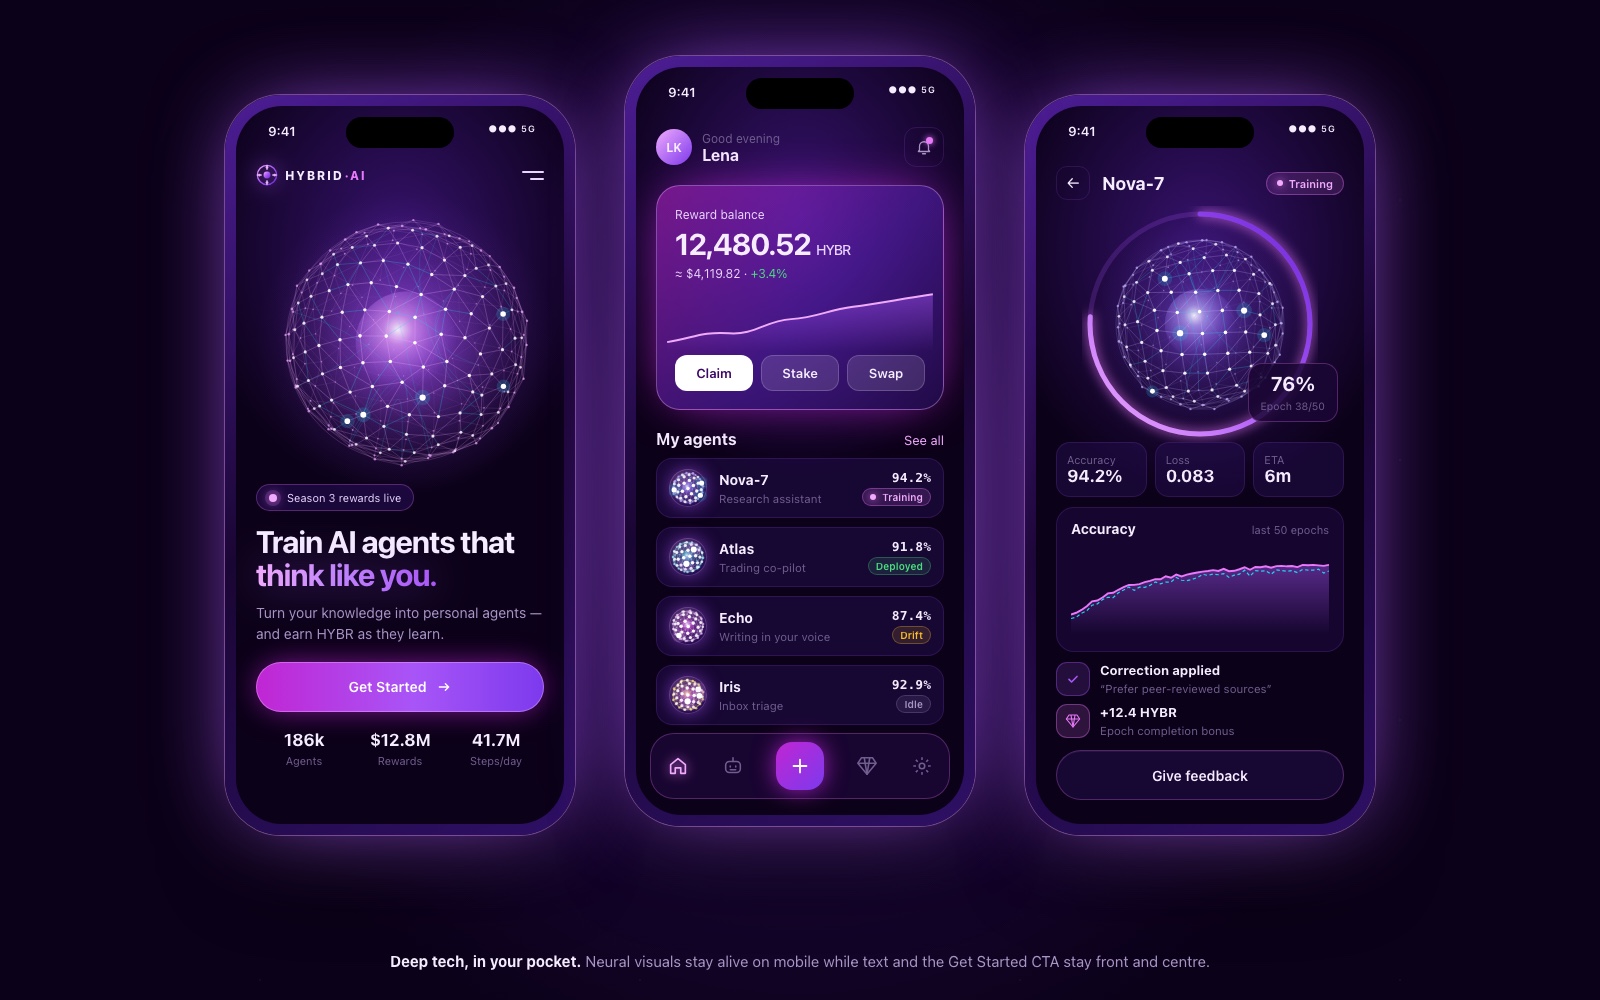
On mobile we kept the neural background effects but put readable text and the "Get Started" CTA first. The phone set covers the landing hero, a compact dashboard with reward actions and an agent list, and an agent detail screen with training progress and a feedback button. A bottom navigation bar with a central create button keeps the core actions within thumb reach.
Design system
Palette. Three core colours do most of the work: dark matter #0B0118 for backgrounds, deep violet #2E1065 for surfaces and cards, and neon purple #A855F7 for actions, highlights and data. Small amounts of green, amber and cyan are used only for status and secondary data series, so they stay meaningful.
Typography. Large, tightly set display headlines use a purple gradient on key phrases. Body text is a clean sans-serif with comfortable contrast, small tracked uppercase labels mark sections, and figures use a monospaced style.
Components. Stat cards, agent cards (avatar, status tag, progress bar), circular gauges, charts in one shared style, pill tags, time filters, timeline nodes and glassmorphism cards. All share one grid and corner radius, which keeps landing page, dashboard and mobile consistent.
Motion and visual language. Glow is the system's main signal. It marks the active tab, the current roadmap phase, the primary button and the live data point. Neural spheres and node networks act as a recurring illustration language that represents agents everywhere they appear.
Responsive strategy. Desktop layouts collapse into single-column stacks on mobile. Hero visuals scale down rather than disappear, and dashboard cards turn into a scannable list. Primary actions move into a bottom bar within thumb reach.
Results
The design connects complex backend technology to a user-friendly frontend. High-fidelity graphics combined with a clean, grid-based layout give the platform a professional yet futuristic interface. That supports its positioning as a leader in personalized AI.
The neural visual language makes agents feel tangible, modular components keep dense data easy to scan, and one identity carries from the landing page to the dashboard on desktop and mobile.